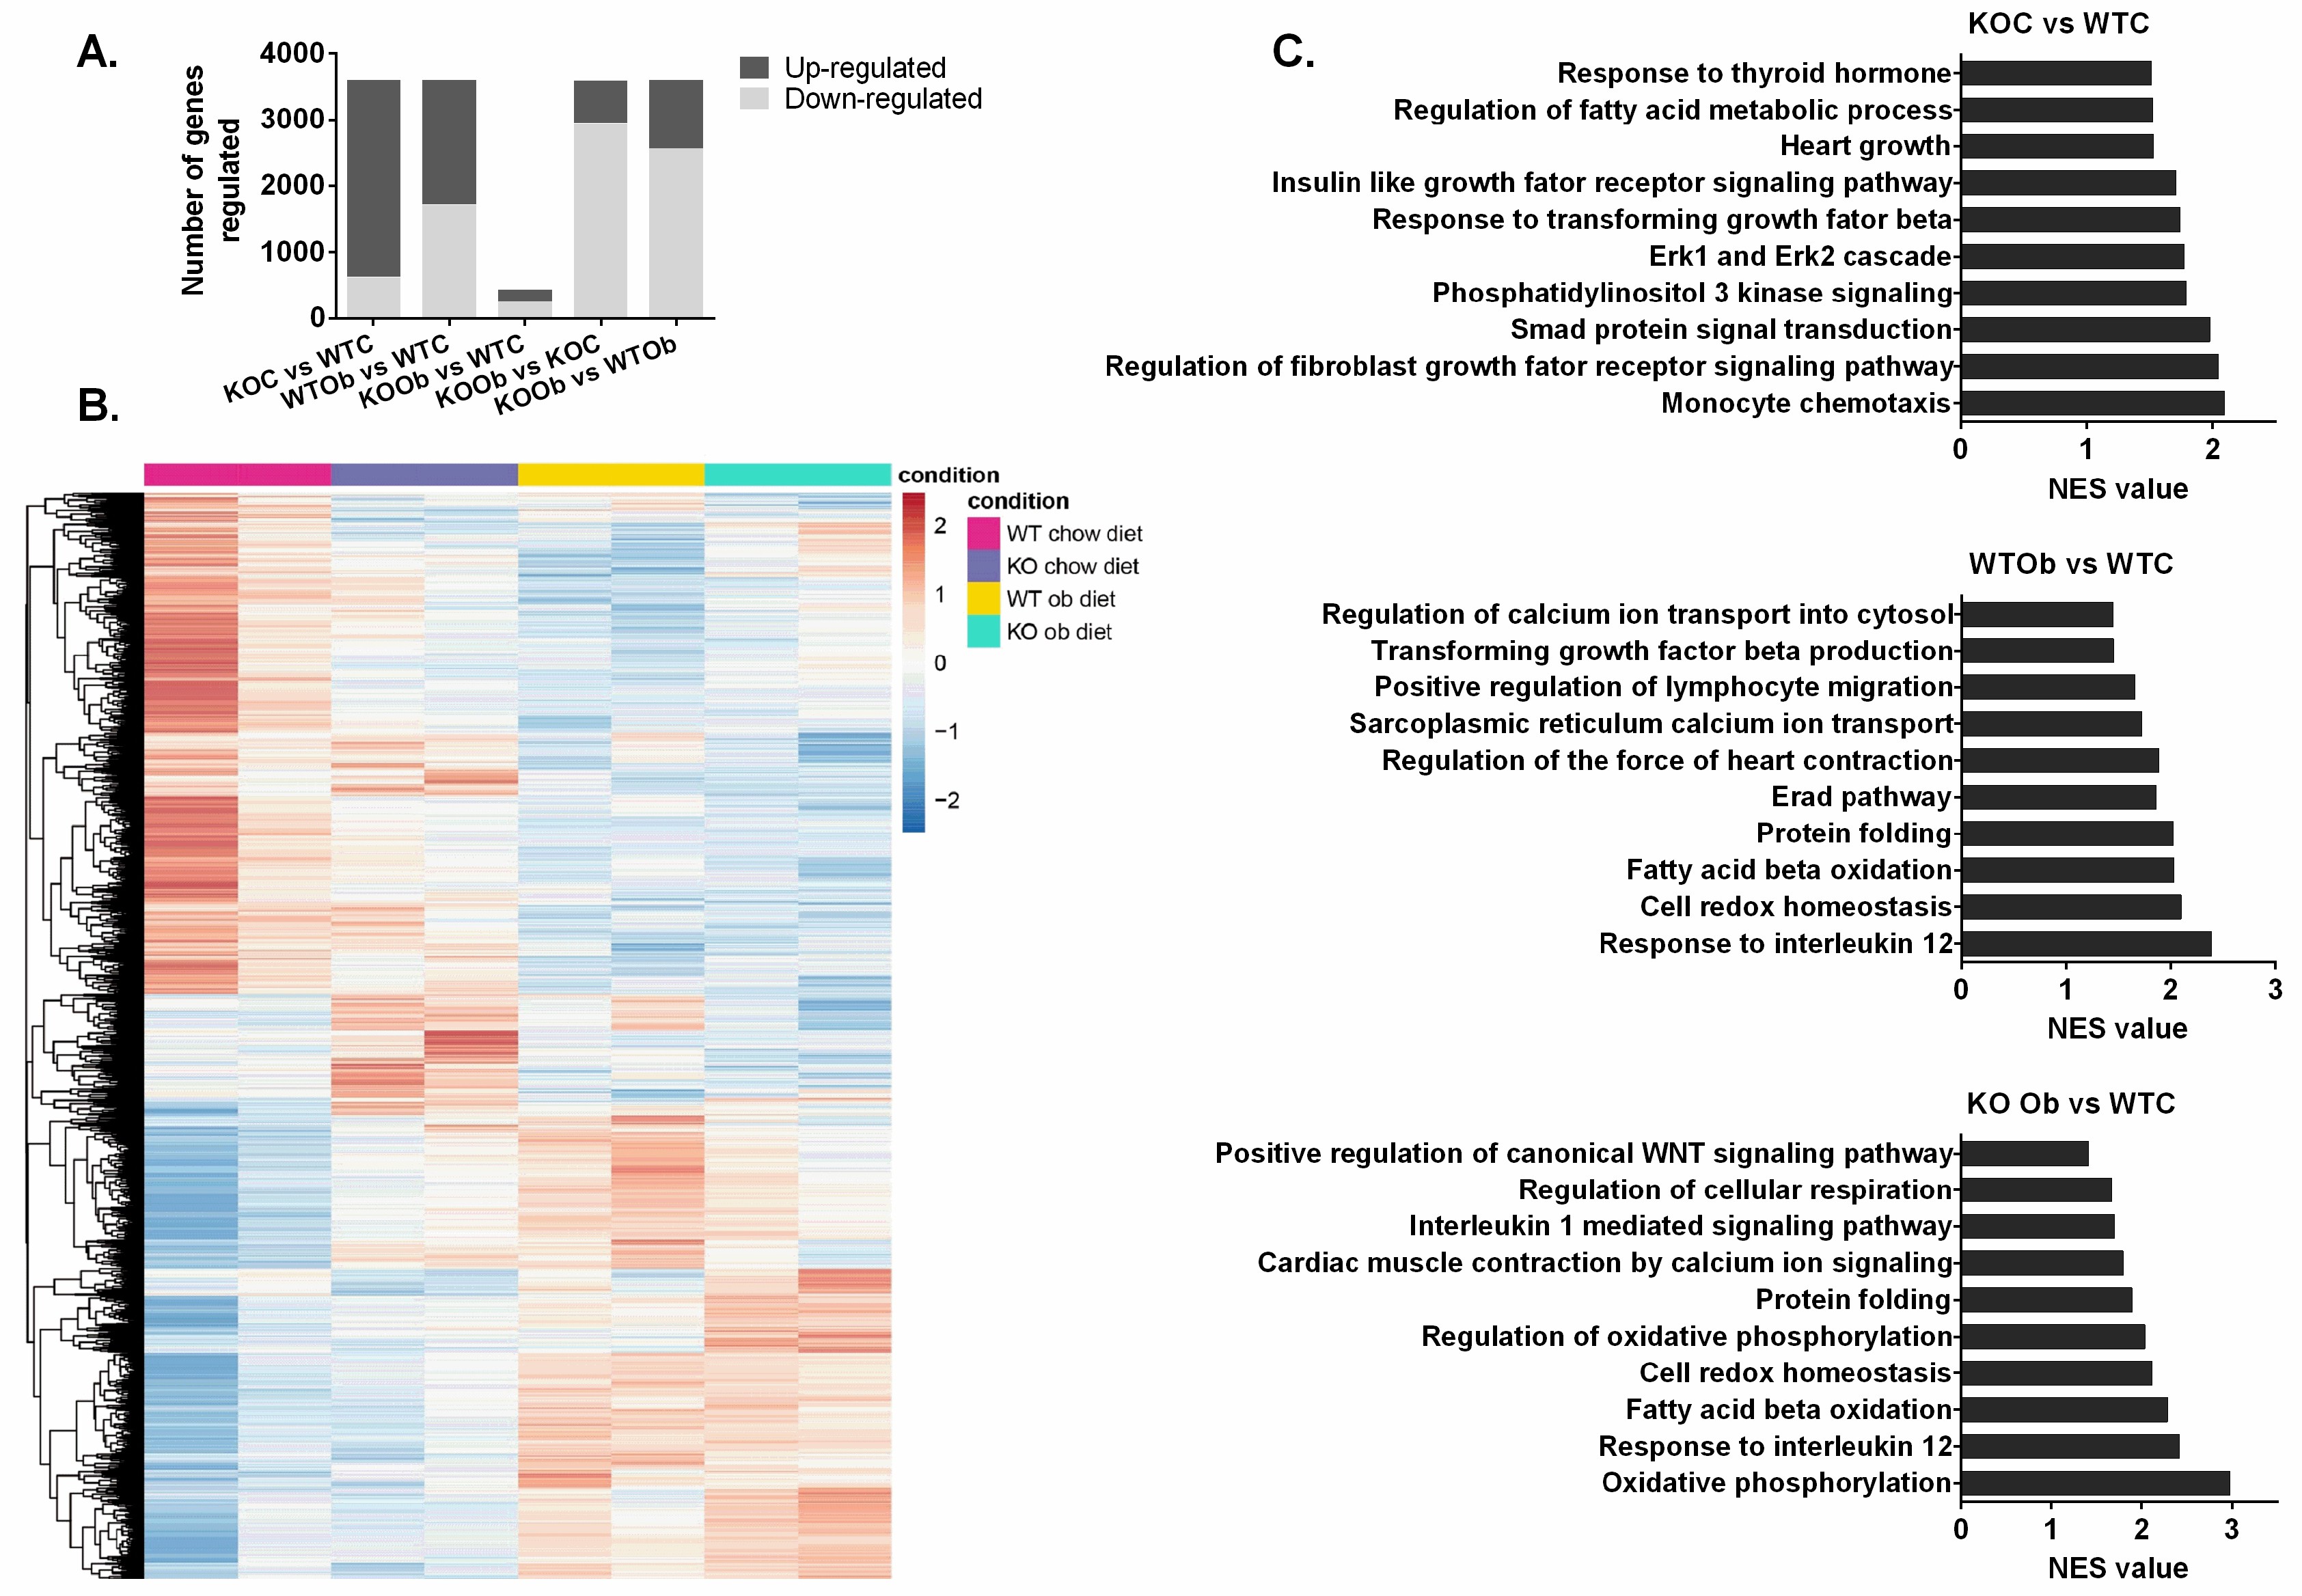
Fig. 4. Deletion of miRNA-22 and obesogenic diet change mRNA expression profiles in female hearts. (A) Number of genes regulated in the hearts of miR-22 KO and WT female mice fed a chow diet or obesogenic diet evaluated by RNA-seq (n=2). (B) Heatmap comparing the differential gene expression between WT obese, miR-22 KO fed a chow diet, and miR-22 obese females vs WT females fed a chow diet. The up-regulated genes are shown in red color and down-regulated genes in blue color (n=2). (C-E) Gene ontology (GO) enrichment analysis was performed using the Gsea, providing the up-regulated pathways enriched GO terms Biological Process (FDR≤0,25; p-value≤0.05; positive NES value).